About the numbers: everything below is the completed 2025 Division I regular season — real records, real finishes, not a projection. RPI is computed the way the site computes it (see the white paper); "at-large-caliber" means a top-45 finish in RPI, the cut line the committee's metric implies.
Analysis · Conference bids
A conference doesn't win bids one team at a time. It wins them together, in September — and the ledger that decides how many at-large teams a league sends to the NCAA Tournament is written almost entirely in non-conference play. Here's the math, and why it makes non-conference wins a team sport played by the whole conference.
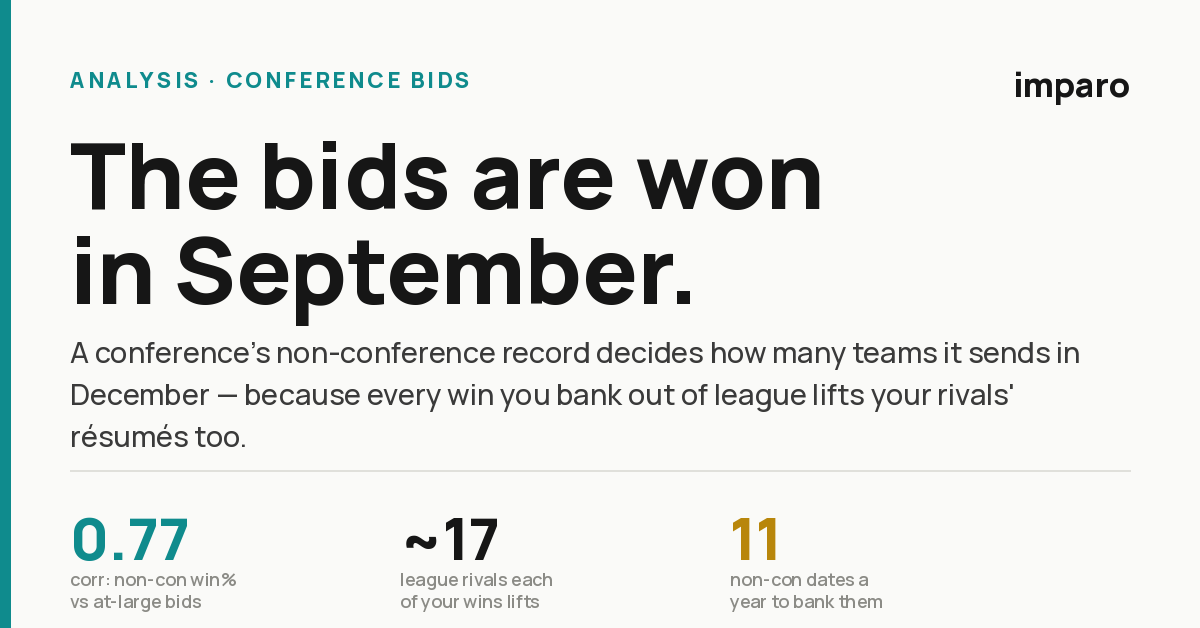
Across all 34 Division I conferences that played a real non-conference slate in 2025, a league's non-conference winning percentage and its number of at-large-caliber teams move together at r = 0.77. Win out of conference and your whole league rises; go .500 out there and your bubble teams stay home.
League play can't manufacture a single bid
Start with what a conference can't control. Inside the league, every win is a league-mate's loss. A 16-team round-robin nets out to exactly .500 by construction — the SEC beats the SEC half the time, always. No amount of conference volleyball, however good, adds a net win to the pile of results the committee's metric reads.
So the only place a league can add wins that lift everyone's résumé is against outside competition. And there isn't much of it: a power-conference team gets roughly 11 non-conference dates all year. Those eleven games — per team, banked in about three weeks of September — are the entire budget from which a conference builds its collective tournament case.
Why one win counts ~17 times
Here's the part that makes it a team sport. RPI is three-quarters about your opponents: half of it is your opponents' winning percentage (OWP), a quarter is your opponents' opponents' (OOWP), and only the last quarter is your own record. That means your winning percentage isn't just your asset — it's an input into the RPI of every team that plays you.
In a round-robin conference, that's almost the entire league. Each SEC team plays about 17 league-mates. So when a team goes out and wins a non-conference match, it nudges its own win% up — and that higher win% then feeds the strength-of-schedule term of all ~17 conference rivals who face it in league play. One non-con win, credited seventeen times across the conference's résumé pool. OOWP spreads it a ring further still.
The flip side is the warning. Lose a non-conference match you should have won and you don't just dent your own profile — you lower the OWP credited to all seventeen teams that play you. In a record-counting system, a league's non-conference results are shared property. Everyone drinks from the same well; everyone poisons it too.
The 2025 scoreboard
Line the leagues up by how they actually did out of conference last season — overall, against the ranked teams, and the bids they ultimately received — and the pattern is hard to miss.
| Conference | Non-con W% | Avg opp PAVE | W% vs top 45 | W% vs top 16 | NCAA bids |
|---|---|---|---|---|---|
| Big Ten | 77% 161-48 | +9.8 | 53% 35-31 | 45% 15-18 | 9 |
| Big 12 | 76% 140-45 | +10.0 | 40% 21-31 | 8% 2-24 | 10 |
| SEC | 74% 130-46 | +10.8 | 54% 30-26 | 48% 13-14 | 5 |
| ACC | 70% 141-61 | +8.7 | 49% 28-29 | 30% 7-16 | 7 |
| American | 64% 104-58 | +1.4 | 0% 0-25 | 0% 0-11 | 3 |
| Big East | 64% 88-50 | +2.9 | 46% 12-14 | 25% 3-9 | 3 |
| Pac-12 | 60% 128-87 | +5.7 | 12% 4-30 | 0% 0-6 | 1 |
| Big West | 50% 75-76 | +5.3 | 24% 7-22 | 0% 0-8 | 2 |
| Mountain West | 46% 60-72 | +5.4 | 11% 2-17 | 0% 0-2 | 0 |
| WCC | 42% 60-83 | +6.4 | 22% 4-14 | 0% 0-5 | 1 |
Avg opp PAVE = the average opponent-adjusted strength (our PAVE rating) of a league’s non-conference opponents; higher = tougher slate (D-I median ≈ +2). W% vs top 45 / 16 = its winning percentage against opponents that finished in RPI’s top 45 (the implied cut line) and top 16 (the host/seed line); gray line is the record. NCAA bids = teams the conference actually placed in the 2025 NCAA tournament (auto + at-large). 2025 completed regular season, sorted by non-con win%.
Winning your non-con is one thing; doing it against the good teams is what a résumé is made of — and that’s where the leagues separate. The Big Ten, SEC and ACC all won about half their non-conference games against top-45 opponents and stayed live against the top 16. The rest barely showed up in those games: the American went 0-25 against the top 45, and the five leagues from the American on down went a combined 0 for 32 against the top 16 out of conference. That is the strength-of-schedule dividend the powers bank and the others simply can’t.
Keeping it honest: good teams both win their non-conference games and rank well, so some of this correlation is just quality showing up twice. The point isn't that r = 0.77 proves cause on its own — it's that the mechanism is structural: because RPI pools opponent win% across a round-robin, a league's non-conference record is mathematically baked into every member's résumé, whether the wins came from powers or from the team fighting for the last bid. "Top-45 finish" is our RPI proxy for at-large-caliber, not the actual committee vote.
Where 2026 is pointed right now
That's the history — and it's already repeating. Non-conference play for 2026 is all but finished, and the leagues that won it are the ones set up to cash it in. Here's where each power conference landed out of conference this year, next to the bids it's now projected to earn.
| Conference | Non-con W% | Avg opp PAVE | W% vs top 45 | W% vs top 16 | Proj. bids |
|---|---|---|---|---|---|
| Big Ten | 79% 146–38 | +9.2 | 63% 36-21 | 42% 10-14 | 11 |
| SEC | 75% 120–40 | +8.6 | 48% 21-23 | 30% 8-19 | 6 |
| Big 12 | 74% 113–40 | +8.7 | 52% 24-22 | 35% 6-11 | 6 |
| ACC | 65% 118–64 | +8.4 | 59% 30-21 | 56% 14-11 | 6 |
| Big East | 62% 79–48 | +2.6 | 20% 5-20 | 9% 1-10 | 3 |
| Pac-12 | 48% 47–51 | +4.7 | 18% 3-14 | 0% 0-2 | 2 |
| Mountain West | 46% 50–58 | +6.7 | 8% 2-22 | 12% 1-7 | 2 |
| Big West | 38% 50–81 | +2.6 | 9% 2-21 | 0% 0-4 | 0 |
2026 non-conference finals through September 20, by current conference membership, sorted by non-con win%. Avg opp PAVE = average opponent-adjusted strength of a league’s non-con opponents (higher = tougher; D-I median ≈ +2). W% vs top 45 / 16 = its win % against opponents currently in the RPI top 45 / top 16 (gray line is the record). “Proj. bids” is the RPI-selected projected field.
A few things stand out. Win rate and projected bids travel together — the leagues north of 70% stack bids, none near .500 does. The average opponent-PAVE column shows the powers didn’t just win more, they played tougher: the Big Ten, SEC, Big 12 and ACC all faced non-con slates around +8 to +9, well above the +2.6 to +6.7 everyone else drew. And the last two columns show how that went against the best of them — the ACC has quietly been the strongest against the top 16 (14-11), the Big Ten the deepest, while the three weakest non-con leagues went a combined 7-57 against the top 45. Winning your non-con is the door; winning it against ranked teams is the résumé.
For the full projected field — simulating the rest of the season 2,000 times, under the committee's metric (RPI) and under MERIT, our quality-and-résumé blend — the bids break down by conference like this. As of September 20, with the model now split roughly half-and-half between last season and this one:
| Conference | RPI | MERIT |
|---|---|---|
| Big Ten | 11 | 12 |
| Big 12 | 6 | 7 |
| SEC | 6 | 6 |
| ACC | 6 | 6 |
| Big East | 3 | 2 |
| American | 2 | 2 |
| Big Sky | 2 | 2 |
| Mountain West | 2 | 2 |
| Pac-12 | 2 | 2 |
| WCC | 2 | 2 |
| Ivy | 2 | 1 |
| United Athletic | 2 | 1 |
| Every other conference | 1 | 1 |
Projected 64-team field, current forecast (2,000 simulations). Every conference sends at least its automatic bid; the numbers above are total teams — auto plus projected at-large. Both fields total 64.
The leagues that won out of conference last fall are the ones stacking projected bids now: the Big Ten is tracking toward 11–12, the Big 12 6–7, the SEC 6, the ACC 6. That's the season's r = 0.77 playing out live. And swap the committee's RPI for a quality-and-résumé metric and the field shifts a few seats — the Big Ten and Big 12 each pick up one, while the Big East, the Ivy and a mid-major give one back — the very lever the rest of this site is about.
Early-season caveat: three weeks in, the forecast is deliberately conservative — it roughly holds current strength constant and still leans on last season, so it's a starting point, not a prediction. It re-runs every few minutes as results come in; the live version is on the Forecast tab.
What a league actually controls
A commissioner can't win conference games for anyone — that ledger always closes at .500. The one lever that moves the whole league's bid count is the one thing scheduled months ahead: how the conference competes in non-conference play. Not just how hard — how well. A league that collectively schedules ambitious-but-winnable matches and then wins them is manufacturing strength-of-schedule for its own bubble teams. A league that schedules soft and still drops games, or schedules a murderers' row and goes .500 in it, hands its bubble nothing.
This is the constructive other half of a point this site has made before. Showcase weekends where the best leagues play each other — the SEC/Big Ten Challenge and its kind — are the best volleyball on the fall calendar, and they should absolutely stay. But because those games are peers-versus-peers, they're zero-sum for the two leagues involved: every win is the other league's loss, so they add no net résumé to either side. The wins that actually lift a conference have to be banked against everyone else — the rest of Division I — where a strong league can genuinely run its record up and carry its whole membership with it.
See how any league's non-conference slate is landing this season, team by team, on the Strength of Schedule and Conference rankings tabs — and read the companion piece, how the SEC/Big Ten Challenge quietly costs the two leagues a bid →
The takeaway for anyone running a conference, or coaching in one: when you win a September match against an outside opponent, you're not just making your own case. You're making sixteen. The tournament field looks like it's decided in December, but the arithmetic that fills it is written now — one non-conference win at a time, credited across the whole league.
Data: completed 2025 Division I women's volleyball regular season. RPI computed per scraper/ratings.py (location-weighted win% + OWP + OOWP, the NCAA formula with the full-record OWP approximation noted in the white paper). Non-conference records count every final between teams in different conferences. "At-large-caliber" = RPI top 45 (the implied cut line); "host/seed line" = RPI top 16. Correlation is across the 34 conferences with ≥10 non-conference games. Top-45 finish is a proxy for at-large selection, not the actual NCAA field.